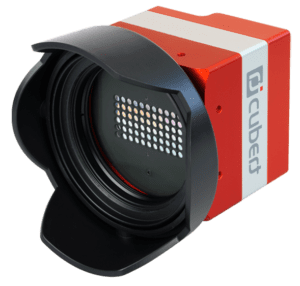

Proof of concept with the Cubert ULTRIS XMR—full-field SiO₂ characterisation in a single acquision
One snapshot, one whole wafer, one thickness map. The Cubert ULTRIS XMR hyperspectral camera measures SiO₂ film thickness across an entire 4-inch wafer in a single exposure — a per-pixel thickness map, its full distribution and its spatial uniformity at once, with no scanning and no moving parts. On thermally oxidised wafers of 100, 300, 500 and 1000 nm nominal thickness, thin-film interference reflectometry recovers the thickness; from ~300 nm upward the measured medians match nominal to within a few percent, and the maps prove that the non-uniformity seen on some wafers is a real property of the oxide — not a measurement artefact. Where a point tool checks a handful of sites, one acquisition inspects the whole wafer.
EXECUTIVE SUMMARY
Thermally grown SiO₂ is a workhorse layer across microfabrication, and its performance depends on hitting a target thickness and holding it uniform across the wafer. The Cubert ULTRIS XMR measures that thickness everywhere on the wafer at once, from a single exposure — no scanning, no moving parts, no point-by-point sampling.
- ≤ 4 % deviation from nominal across the demonstrated 300 nm – 1 μm range — inside even the supplier’s tightest ±5 % oxide tolerance.
- ~1 million thickness values per acquisition (≈1 MP × 61 bands) in a single exposure—the whole wafer, not a handful of sites.
- Maps & statistics, not a single number—every pixel yields a thickness, so the whole-wafer distribution and spatial pattern come from one frame.
- Real non-uniformity, proven — a ~30 nm wedge on the 1000 nm wafer rotates with the wafer, ruling out an optical artefact.
- Complementary to ellipsometry — point tools remain the reference for ultrathin films; the snapshot adds the whole wafer at once.
EXPERIMENTAL DETAILS
1.1 · ACQUISITION METHOD: SNAPSHOT HYPERSPECTRAL IMAGING
The Cubert ULTRIS XMR is a snapshot hyperspectral camera: in a single exposure it captures a complete data cube I(x, y, λ) with about one megapixel of spatial resolution (1000 × 1000 pixels) and 61 spectral bands spanning 430–910 nm. Unlike push-broom or whiskbroom spectrometers, which build a hypercube by scanning over time, the snapshot architecture needs no moving axis: every pixel carries a full reflectance spectrum in every frame [1]. This has two practical consequences. First, an entire wafer is imaged, spectrally resolved, in a single exposure of a few tens of milliseconds, whereas a point-scanning instrument must visit each site in turn. Second, because a thickness is obtained at every pixel, the fullwafer distribution and its spatial pattern follow from one frame rather than from a few sampled points.
One snapshot, one whole wafer, one thickness map. The Cubert ULTRIS XMR hyperspectral camera measures SiO₂ film thickness across an entire 4-inch wafer in a single exposure — a per-pixel thickness map, its full distribution and its spatial uniformity at once, with no scanning and no moving parts. On thermally oxidised wafers of 100, 300, 500 and 1000 nm nominal thickness, thin-film interference reflectometry recovers the thickness; from ~300 nm upward the measured medians match nominal to within a few percent, and the maps prove that the non-uniformity seen on some wafers is a real property of the oxide — not a measurement artefact. Where a point tool checks a handful of sites, one acquisition inspects the whole wafer.
Why thickness measurements on SiO₂
Thermally grown SiO₂ is a workhorse layer across microfabrication, and its performance depends on hitting a target thickness and holding it uniform across the wafer. The Cubert ULTRIS XMR measures that thickness everywhere on the wafer at once, from a single exposure — no scanning, no moving parts, no point-by-point sampling.
- ≤ 4 % deviation from nominal across the demonstrated 300 nm – 1 μm range — inside even the supplier’s tightest ±5 % oxide tolerance.
- ~1 million thickness values per acquisition (≈1 MP × 61 bands) in a single exposure—the whole wafer, not a handful of sites.
- Maps & statistics, not a single number—every pixel yields a thickness, so the whole-wafer distribution and spatial pattern come from one frame.
- Real non-uniformity, proven — a ~30 nm wedge on the 1000 nm wafer rotates with the wafer, ruling out an optical artefact.
- Complementary to ellipsometry — point tools remain the reference for ultrathin films; the snapshot adds the whole wafer at once.
Robust by design. The thickness is read from the wavelength positions of the interference peaks, not from the absolute reflectance level — so the result is inherently robust to illumination and intensity variation, a practical advantage for the factory floor.
Download the full Technical Note (PDF)
1. EXPERIMENTAL DETAILS
1.1 · ACQUISITION METHOD: SNAPSHOT HYPERSPECTRAL IMAGING
The Cubert ULTRIS XMR is a snapshot hyperspectral camera: in a single exposure it captures a complete data cube I(x, y, λ) with about one megapixel of spatial resolution (1000 × 1000 pixels) and 61 spectral bands spanning 430–910 nm. Unlike push-broom or whiskbroom spectrometers, which build a hypercube by scanning over time, the snapshot architecture needs no moving axis: every pixel carries a full reflectance spectrum in every frame [1]. This has two practical consequences. First, an entire wafer is imaged, spectrally resolved, in a single exposure of a few tens of milliseconds, whereas a point-scanning instrument must visit each site in turn. Second, because a thickness is obtained at every pixel, the fullwafer distribution and its spatial pattern follow from one frame rather than from a few sampled points.
1.2 · MEASUREMENT SETUP AND SAMPLES
The wafer lies flat and is imaged from above in reflection. The ULTRIS XMR with a 50 mm lens views the sample from ≈ 60 cm. A 750 W halogen floodlight aimed at the ceiling illuminates a suspended PMMA diffuser plate, which re-radiates a broad, smooth field onto the wafer—near-normal, glare-free illumination with no specular hot-spot. The camera is tilted about 5° from the normal so it does not image its own reflection in the mirror-like oxide (Fig. 1); a white reference target sits in the field of view.
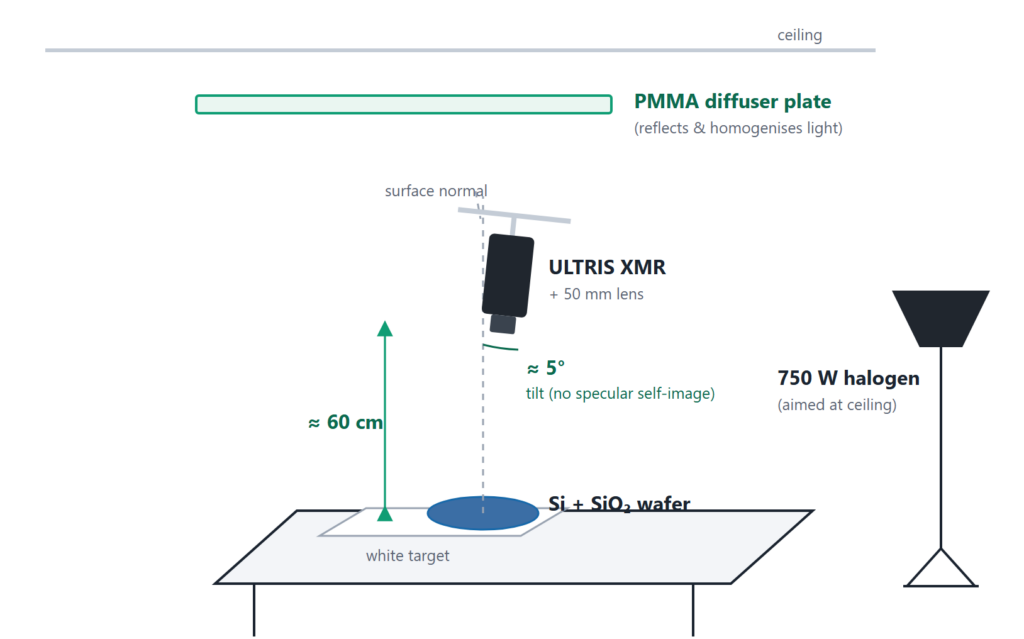
Figure 1 · Measurement setup (schematic). The ULTRIS XMR images the wafer from ≈60 cm, tilted ~5° from the normal to avoid its own reflection; a 750 W halogen lamp is aimed at the ceiling and re-radiated by a horizontal PMMA diffuser plate for smooth, near-normal illumination.
Samples. Boron-doped (p-type) 4-inch Si wafers with thermally grown SiO of four nominal thicknesses—100, 300, 500, and 1000 nm. The oxide is grown by thermal oxidation (it grows into the wafer, rather than being deposited) [2, 3]. Three separate 500 nm wafers (A, B, C) probe wafer-to-wafer uniformity.
| Parameter | Value |
|---|---|
| Camera | Cubert ULTRIS XMR (1 MP, 61 bands) |
| Lens · working distance | 50 mm · 60 cm |
| Spectral window | 430–910 nm (61 bands) |
| Illumination | 750 W halogen → ceiling → PMMA diffuser (indirect, diffuse) |
| Geometry | near-normal; camera tilted 5° |
1.3 · PHYSICAL PRINCIPLE: THIN-FILM INTERFERENCE
Light striking a transparent SiO film on silicon is partly reflected at the air/SiO interface (R ) and partly at the SiO /Si interface (R ). The second wave travels an extra optical path 2·n·d·cos θ; the two reflected waves interfere, so the measured reflectance oscillates with wavelength — interference maxima and minima appear whose spacing encodes the film thickness [4, 5].
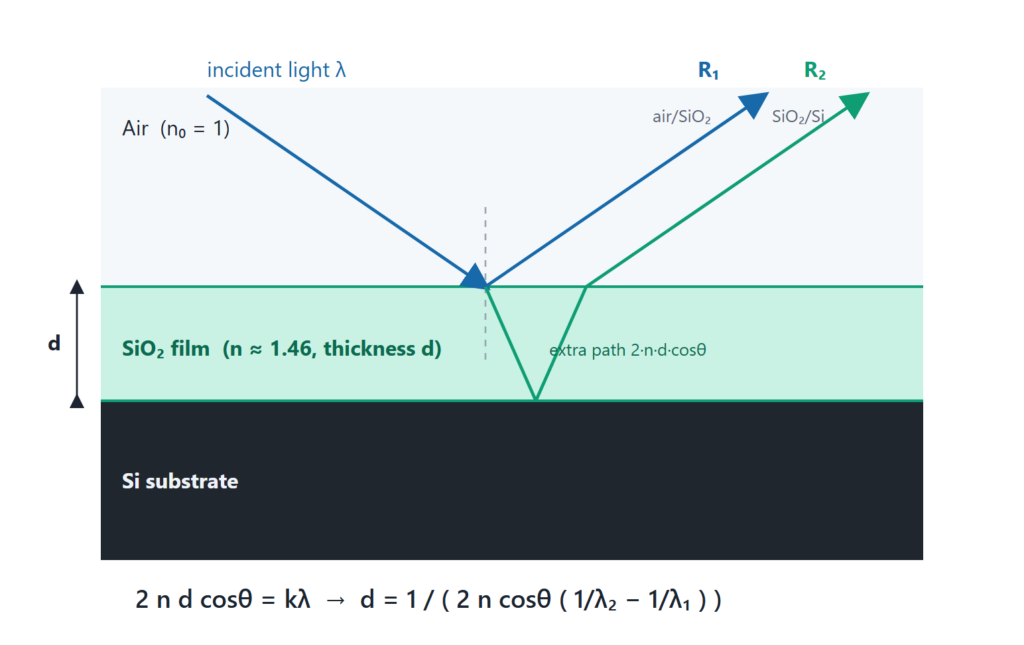
Figure 2 · Thin-film interference on SiO₂/Si. Reflections R₁ (air/SiO₂) and R₂ (SiO₂/Si) interfere; the phase difference depends on the optical path 2·n·d·cos θ.
For near-normal incidence, constructive interference occurs when 2·n·d·cos θ = k·λ (k = 1, 2, 3, …). Two adjacent reflectance maxima at λ > λ then give the film thickness directly from their spacing:
d = 1 / ( 2 · n · cos θ · ( 1/λ − 1/λ ) )
with n = 1.46 for thermal SiO [6]. The camera is tilted by 5° from the normal (so it does not image itself in the mirror-like oxide); by Snell’s law the internal angle is approximately 3.4°, giving cos θ ≈ 0.998 — a correction below 0.2 %, included by our analysis.
COMPLEMENTARY TO ELLIPSOMETRY — NOT A REPLACEMENT
For the highest absolute precision on ultrathin films, spectroscopic ellipsometry — which reads the change in polarisation state (Ψ, Δ) on reflection — remains the reference method [7, 8]. The ULTRIS XMR does something different: spectral reflectometry that maps the whole wafer in a single snapshot. The two are complementary — ellipsometry for absolute precision at a few points, snapshot hyperspectral for full-field coverage and speed.
2. RESULTS
2.1 · REFLECTANCE SPECTRA BY THICKNESS
Each wafer was imaged and three regions of interest (red, blue and green) were averaged into representative spectra (Fig. 3). The result is immediate and intuitive: the thicker the oxide, the more interference fringes fall within the fixed 430–910 nm window, because the fringe spacing shrinks as the film grows. Variances in spectra on the same wafer display variances in film thickness, which are analysed later on.
Why the method has a lower limit (~300 nm). The fringe method needs at least two interference maxima inside 430–910 nm. As the film gets thinner, adjacent maxima move further apart, and eventually only one — or none — remains in range. For a 100 nm oxide the first-order maximum sits near λ ≈ 2·n·d ≈ 292 nm, i.e. in the UV below the camera’s lower bound; only its long-wavelength flank reaches the visible, exactly as the 100 nm spectrum shows. Peak counting therefore does not apply below roughly 300 nm — a limit of the spectral window, not a measurement error. A single in-band extremum can still give a thickness estimate below this limit if the approximate thickness is known beforehand.
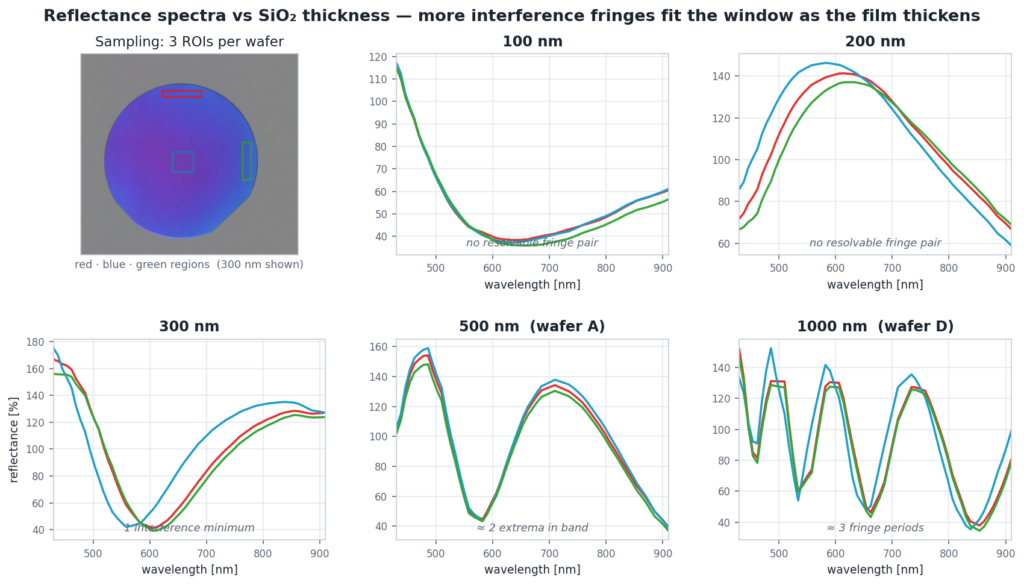
Figure 3 · Reflectance spectra versus SiO₂ thickness (three ROIs per wafer; the 300 nm wafer shows the ROI layout). 100 & 200 nm show no resolvable fringe pair; 300 nm shows one minimum; 500 nm two extrema; 1000 nm about three fringe periods. Small ROI-to-ROI shifts (clearest at 1000 nm) reflect the wafer’s own thickness variation.
2.2. WORKED THICKNESS DETERMINATION
| 500 NM — WAFER A | 1000 NM — WAFER D |
|---|---|
| maxima ≈ 483 & 710 nm → orders k = 3, 2 | maxima ≈ 488 / 588 / 736 nm → k = 6, 5, 4 |
| → d ≈ 490 nm (map median 488 nm) | → d ≈ 1008 nm (map median 1011 nm) |
The orders come out integer and mutually consistent (an order check); the spacing formula gives the same result. Peak localisation — largest for maxima near the window edges — is the dominant uncertainty.
2.3. FULL-WAFER THICKNESS MAPS & UNIFORMITY
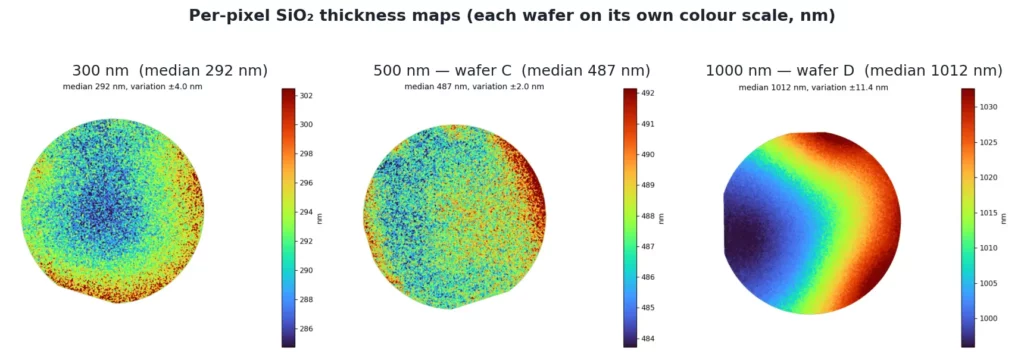
Applying the calculation at every pixel turns each hypercube into a thickness map of the whole wafer. The 300 and 500 nm wafers are largely uniform (a faint radial trend), while the 1000 nm wafer shows a strong, smooth wedge of about 30 nm across its diameter.
THE NON-UNIFORMITY IS REAL: IT ROTATES WITH THE WAFER
Is the wedge a property of the oxide or an optical artefact? The test is simple: rotate the wafer and remeasure. An illumination or lens artefact would stay fixed in the camera frame; instead the pattern rotates with the wafer — the low-thickness region stays locked to the wafer flat, and the whole high–low axis turns by the same angle. Median and spread stay essentially constant (median ≈ 1010–1012 nm, robust FWHM ≈ 9–11 nm), confirming both reproducibility and that the wedge is genuine. This behaviour was tested and confirmed on every wafer measured. Such smooth gradients are characteristic of thermal oxidation, where furnace temperature and gas-flow gradients produce position-dependent growth [9].
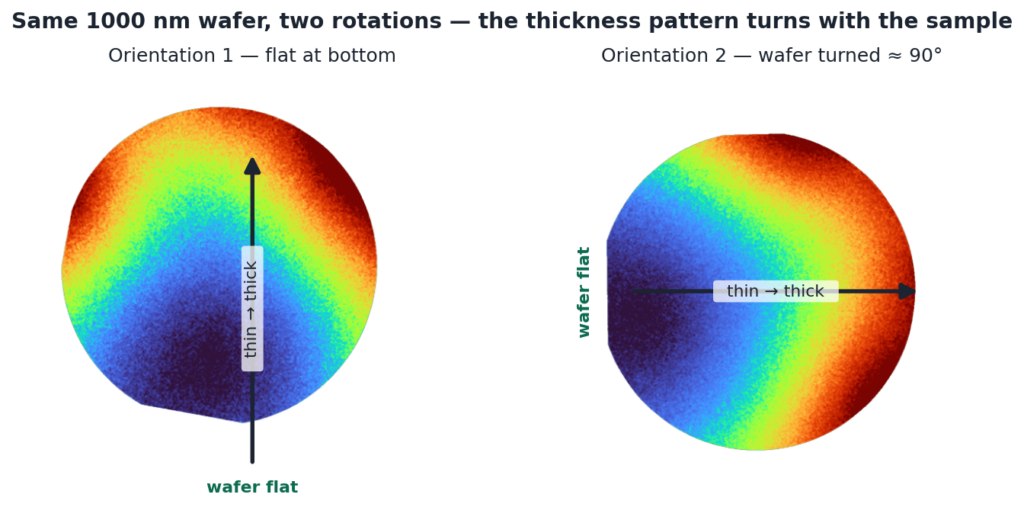
Figure 5 · Rotation test (1000 nm wafer). Turning the wafer ≈90° moves both the flat and the thin→thick axis together — proof that the thickness pattern belongs to the sample, not the instrument.
2.4. THICKNESS DISTRIBUTIONS & ACCURACY
Per-pixel thicknesses were histogrammed (1 nm bins). To stay valid even when the distribution is not bellshaped, we report model-free descriptors — the median (central value) and a robust FWHM (central 76 % of pixels). The shape of each histogram is itself a uniformity signature: the 500 nm wafers A and C are near-Gaussian (R² ≈ 0.99–1.00) and narrow (FWHM 4.4 and 5.9 nm); the 300 nm wafer is approximately Gaussian (R² ≈ 0.92); the 500 nm wafer B is broader (FWHM 14.8 nm); and the 1000 nm wafer D is clearly non-Gaussian (R² ≈ 0.52) — the fingerprint of its ~30 nm wedge. The three nominally identical 500 nm wafers differ markedly, so within-wafer uniformity is a wafer-specific, process-driven property that only a full-field measurement reveals. Figure 6 puts the five distributions side by side: wafers 500 A and C form narrow, symmetric peaks, wafer 500 B a visibly broader one, and wafer D a wide, double-humped distribution whose two humps are the thin and the thick end of its wedge — so the width and shape of the peak alone already tell uniform wafers from non-uniform ones.
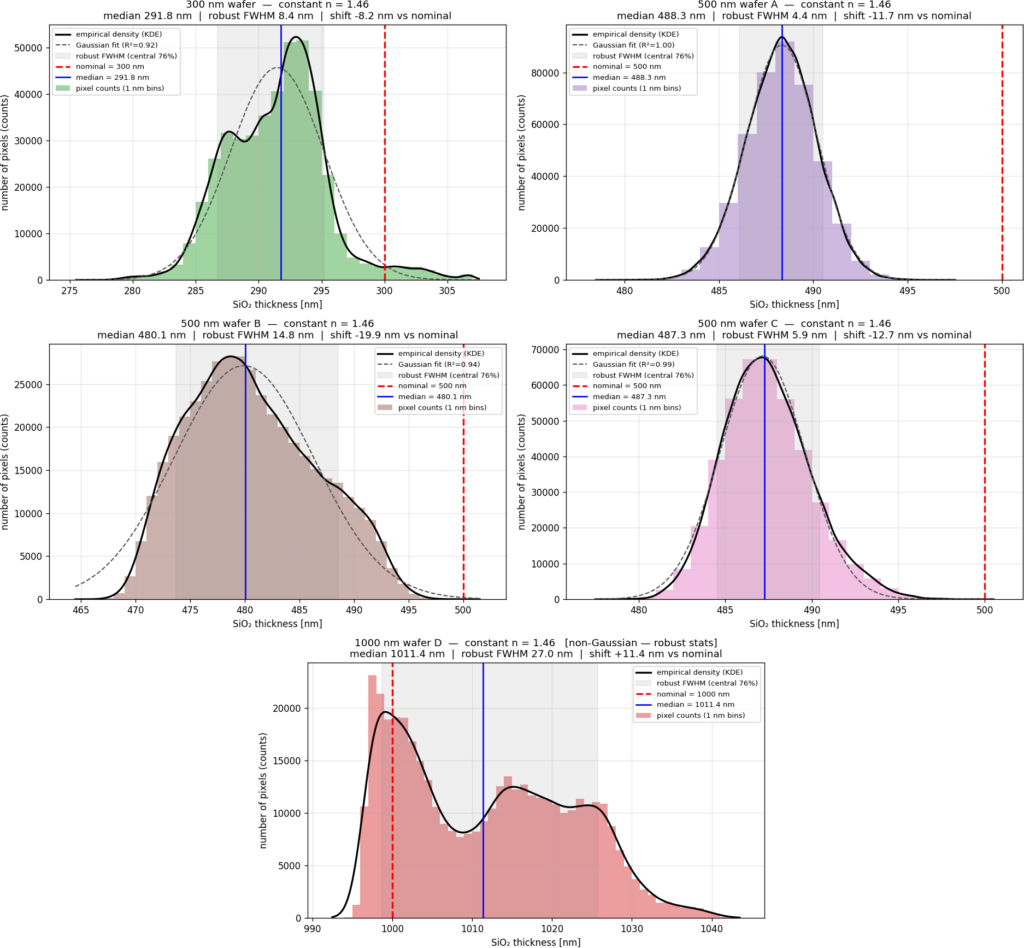
Figure 6 · Per-wafer thickness distributions (pixel counts vs SiO₂ thickness, 1 nm bins). Uniform oxides (500 A, C) are Gaussian; the 1000 nm wafer (D) is non-Gaussian — the wedge shows up as a broad, double-humped distribution.
Measured versus nominal. Comparing each wafer’s measured median with its nominal target shows how closely the oxidation process hit specification.
| WAFER | NOMINAL | MEDIAN | ROBUST FWHM | DEVIATION |
|---|---|---|---|---|
| 300 nm | 300 nm | 292 nm | 8.4 nm | −2.7 % |
| 500 nm A | 500 nm | 488 nm | 4.4 nm | −2.3 % |
| 500 nm B | 500 nm | 480 nm | 14.8 nm | −4.0 % |
| 500 nm C | 500 nm | 487 nm | 5.9 nm | −2.5 % |
| 1000 nm D | 1000 nm | 1011 nm | 27.0 nm | +1.1 % |
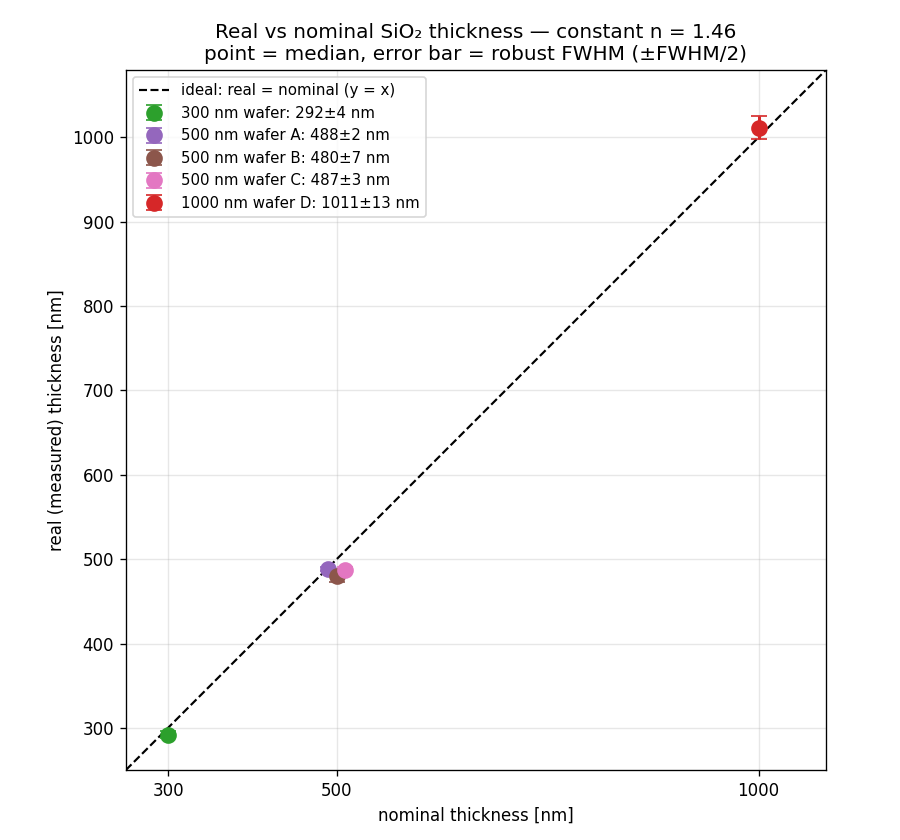
Figure 7 · Measured vs nominal thickness. Point = median, bars = robust FWHM; the dashed line is the ideal. All wafers sit just below (300, 500 nm) or just above (1000 nm) it.
3. SUMMARY AND OUTLOOK
- The ULTRIS XMR determines SiO thickness on silicon full-field, from a single snapshot, via thin-film interference reflectometry — returning a complete thickness map and distribution per wafer.
- In the demonstrated 300 nm to 1 µm range, measured medians agree with nominal to a few percent.
- The method resolves real spatial non-uniformity — proven a sample property by the rotation test — and separates uniform from non-uniform wafers by histogram shape.
- This is reflectometry, complementary to ellipsometry. Ellipsometry remains the reference for highest absolute precision on very thin (<10 nm) films; the snapshot approach wins on speed and full-field coverage.
CUSTOMER BENEFIT & WHERE IT APPLIES
If you run or buy thermal oxidation, you know your thickness target. What you do not know, wafer by wafer, is whether the oxide holds that target everywhere — and a sampling tool cannot tell you. This study makes the gap concrete. Three of our wafers carried the same 500 nm specification and all three are comfortably in spec; their medians agree to within about 8 nm. A conventional multi-site recipe would have signed off all three as equivalent. They are not: one of them is roughly three times less uniform than the other two. From nine points you cannot separate process scatter from measurement scatter, so that difference simply never appears in the log — yet it is precisely the signal that distinguishes a furnace under control from one that is drifting.
The full-field measurement also answers the question a point tool cannot even pose: where is the oxide off target, and in what pattern? A single acquisition returns on the order of a million thickness values, so a radial trend, an edge effect, a furnace gradient or a local defect appears as a recognisable shape rather than as an unexplained outlier. Our 1000 nm wafer shows this directly — a smooth 30 nm wedge across the diameter that a rotation test proves belongs to the oxide, not to the instrument. Diagnosis becomes possible because the spatial pattern, not just the number, is available; and because every wafer can be measured this way, out-of-spec material is caught before it absorbs further process cost.
Two properties make this practical rather than merely elegant. The thickness is read from the wavelength positions of the interference fringes, not from an absolute reflectance level, so lamp ageing, intensity drift and moderate illumination non-uniformity do not shift the result — there is no calibration standard to remeasure between wafers. And there is no scanning stage: nothing to align per site, nothing to wear out, no moving axis to keep clean. Nor does this displace your ellipsometer; it changes its job. Let the ellipsometer certify absolute thickness at a few points, where it is unbeatable, and let one snapshot vouch for the remaining 99.999 % of the wafer. Where this matters most — a quick overview of applications working with relatively thick thermal oxides (~0.3–2 µm):
- MEMS & microsensors — membrane stiffness and resonator frequency follow oxide thickness and the stress that comes with it, so a gradient across the wafer becomes a spread in device behaviour across the die map. A thickness map is the earliest place that yield loss is visible [10, 11].
- Power & discrete devices — field and isolation oxides govern isolation and influence breakdown. The device that fails is not the average one; it sits at the thinnest point on the wafer, which only full-field coverage locates [12].
- Silicon photonics / integrated optics — a buffer oxide that is locally too thin leaks light into the substrate. Propagation loss is set by the worst region on the wafer — exactly what an averaged multisite number conceals [13].
- Reference & calibration wafers — if you supply or use certified thermal-oxide standards (e.g. NIST SRM 2530), the uniformity of the standard is part of what you are selling or trusting. One acquisition documents it across the entire wafer instead of at the certified point [14].
In each of these cases the quantity that decides yield is not a thickness. It is a thickness map.
SPEED AND INLINE POTENTIAL
Cycle time is where full-field measurement changes not just how well you inspect, but how much you can afford to inspect. The whole wafer arrives in one exposure of a few tens of milliseconds; nothing scans and nothing indexes, so measurement time does not grow with the number of sites you care about. Serial ellipsometry or reflectometry spends seconds per point and tens of seconds to minutes per wafer to assemble a picture from a handful of sites — and that cost is exactly why most lines sample a few wafers per lot instead of measuring all of them. With a snapshot, a complete map on every wafer costs less measurement time than a sampled recipe on one. Sampling stops being an economic necessity. The trade is a little per-point sensitivity for about a million points at once.
NEXT STEPS
Two extensions follow naturally, both building directly on the full-field capability demonstrated here. A camera configured for a wider spectral range would push the fringe method below the present ~300 nm limit; and a strobed inline head would bring the same whole-wafer thickness map to the production line for 100 % in-process inspection. We are confident in these directions precisely because the underlying fullfield measurement is already proven in this study.
Work with us. Photon Mission supports evaluation of a specific application through a feasibility study on your reference samples — documenting repeatability, uncertainty and integration limits for your actual material system and thickness range. Send us reference samples from your process; for a technical or application discussion, contact the Photon Mission application-engineering team here CONTACT US
4 REFERENCES
Thank you to Cubert for letting them post their whitepaper. Please find below the references they used:
- N. Hagen, M. W. Kudenov, “Review of snapshot spectral imaging technologies,” Opt. Eng. 52(9), 090901 (2013). doi:10.1117/1.OE.52.9.090901
- B. E. Deal, A. S. Grove, “General relationship for the thermal oxidation of silicon,” J. Appl. Phys. 36(12), 3770 (1965). doi:10.1063/1.1713945
- S. M. Sze, M.-K. Lee, Semiconductor Devices: Physics and Technology, 3rd ed., Wiley (2012).
- E. Hecht, Optics, 5th ed., Pearson (2017), Ch. 9.
- R. Swanepoel, “Determination of the thickness and optical constants of amorphous silicon,” J. Phys. E 16(12), 1214 (1983). doi:10.1088/0022-3735/16/12/023
- I. H. Malitson, “Interspecimen comparison of the refractive index of fused silica,” J. Opt. Soc. Am. 55(10), 1205 (1965). doi:10.1364/JOSA.55.001205
- M. Rastgou et al., “Comparison of thin-film thickness measurements using ellipsometry and reflectometry with uniform samples,” Metrologia 63(1), 015006 (2026). doi:10.1088/1681-7575/ae3964
- H. Fujiwara, Spectroscopic Ellipsometry: Principles and Applications, Wiley (2007).
- S.-K. Yang, A. R. Ansari Dezfoli, “Thermal uniformity enhancement in vertical diffusion furnaces…,” Int. J. Adv. Manuf. Technol. (2026). doi:10.1007/s00170-026-17767-6
- K. E. Petersen, “Silicon as a mechanical material,” Proc. IEEE 70(5), 420 (1982). doi:10.1109/PROC.1982.12331
- J. M. Bustillo, R. T. Howe, R. S. Muller, “Surface micromachining for MEMS,” Proc. IEEE 86(8), 1552 (1998). doi:10.1109/5.704260
- B. J. Baliga, Fundamentals of Power Semiconductor Devices, Springer (2008).
- S. Sridaran, S. A. Bhave, “Nanophotonic devices on thin buried oxide SOI substrates,” Opt. Express 18(4), 3850 (2010). doi:10.1364/OE.18.003850
- NIST, Standard Reference Material 2530 (SiO₂-on-Si thickness standard).